| ||||||
| | ||||||
| The Technology Revolution As everybody knows microprocessor and computers have replaced and revolutionized many technologies and professions. It all started with desktop publishing, followed by digital photography and photo editing, Computer Aided Design (2d-CAD), 3D design, rapid prototyping and 3D printing, Computer Aided Manufacturing (CAM), robotics in factories, cell phones, electronic music instruments, etc.... This revolution has touched many engineering fields killing old technologies, factories and professions. I have lived through this change myself as I describe on my 3d Design page. Two of the last areas where home computers are getting capable and fast enough of performing the computations are the Finite Element Analysis (FEA) to determine stresses and deformation in mechanical parts under load and the Computational Fluid Dynamics (CFD). Many parts are too complex for manual computing of stresses but good targets for FEA. The CFD in turn can solve the often chaotic nature of fluid flows. Finally now, when we have the multicore home computers with over 3 GHz speed, both the FEA and the CFD are within reach of computing capabilities of an ordinary hobby engineer. | ||||||
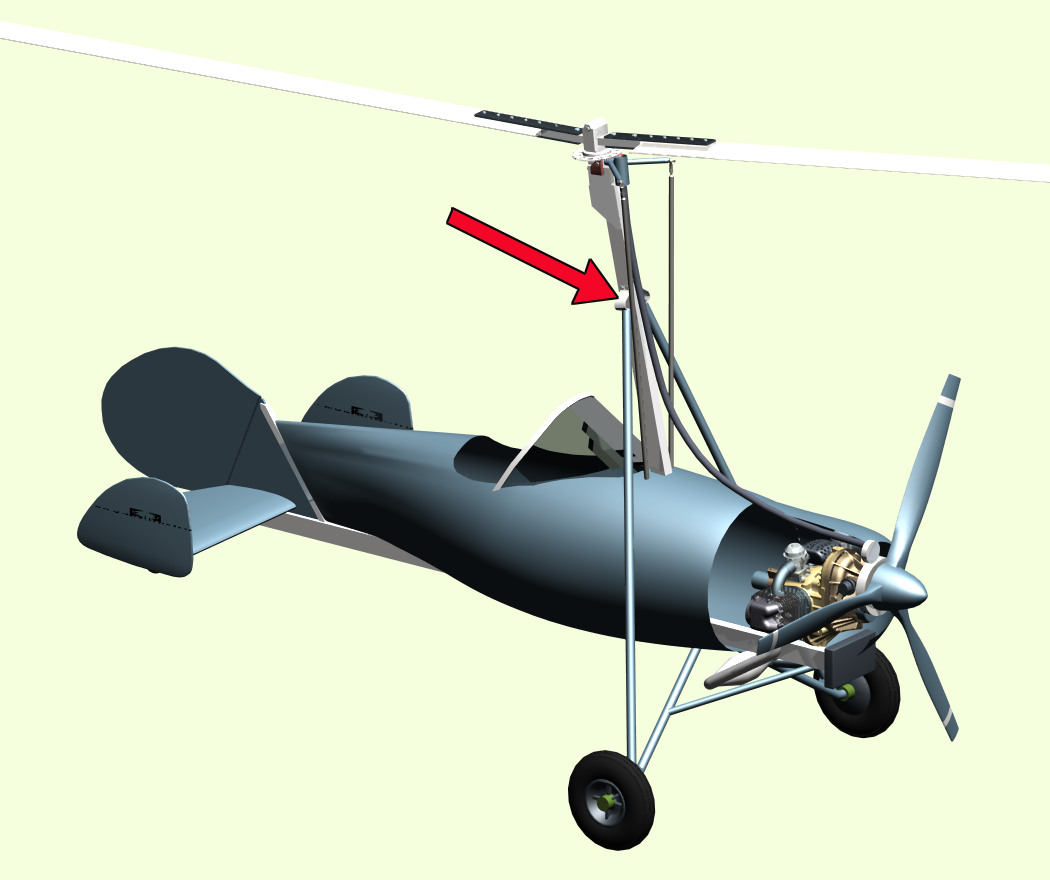
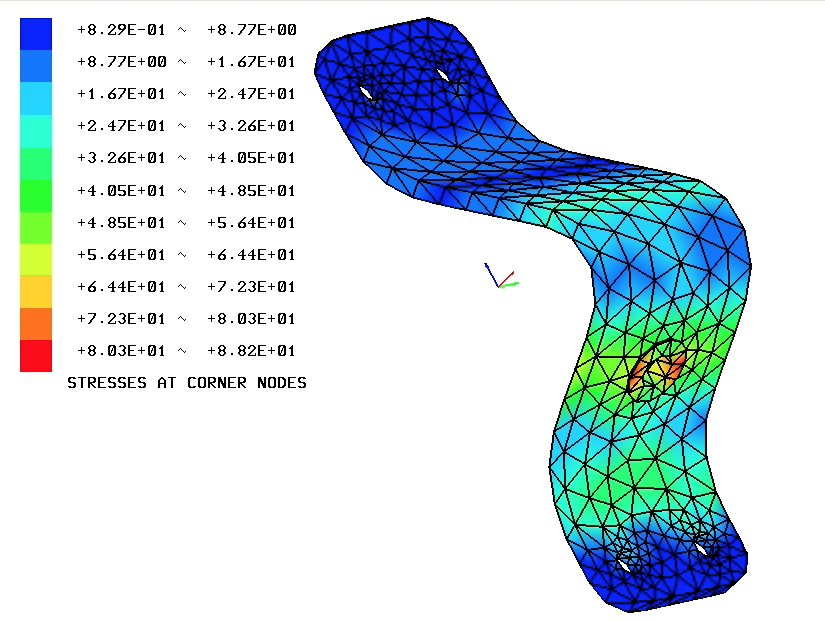
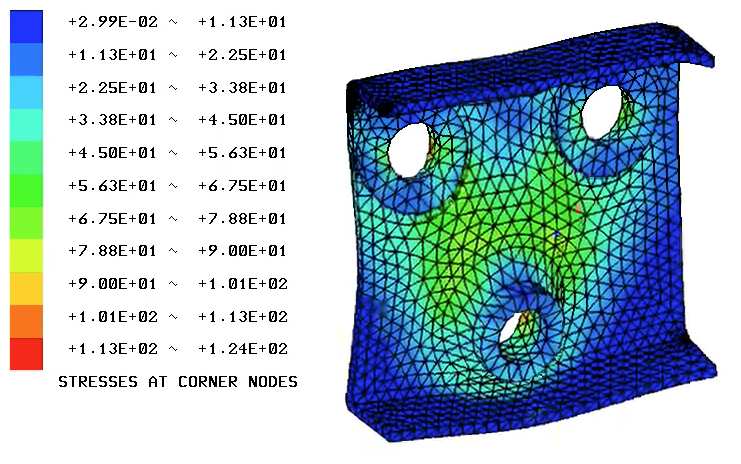
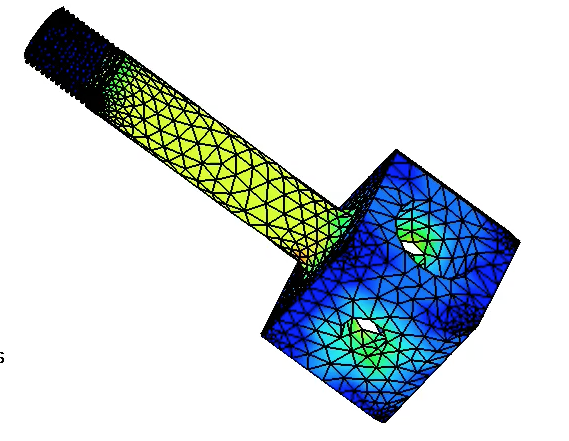
| FEA FEA programs have been around for a long time with such well known products like Abacus, Nastran and Ansys. Some years ago I was searching for a freeware FEA program to analyze the stresses of some aircraft parts I had designed. I was fortunate to find the Z88Aurora from Beyreuth University. The program runs in Windows, Linux and Mac OSX/Unix. I dont go to details of installation and using the program but only want to show a simple computing example. You must be able of understand manual stress calculations and predicting the boundary conditions (support structure reactions) manually before you can use the program. As an example I present here the landing gear bracket from a Pittbull autogyro. My friend Seppo was building one and it occurred to me that the landing gear struts had a very short stroke to absorb a hard landing. So I modeled the Pittbull with special attention to landing gear details and calculated the strut loads for a 3g landing force. I then applied this load to the bracket in Z88Aurora and got the stresses involved and the bracket deformation under load. It is shown here highly exaggerated in the video below. There are also two other example parts from autogyro rotorhead models (Click the pictures to see the videos).
CAUTION! It is easy to make big mistakes (orders of magnitude) with the FEA. One must carefully use the right measures and units. In metric system they are m, kg, Newtons (N), Megapascals (MPa), etc. It is recommended that one should make some simple manual test calculations to verify the results to be on proper level and not 10 times too high or too low. | ||||||
CFD In late
sixties, when I was working for the Helsinki Technical University, a
wind tunnel was built and added to its facilities for aerodynamic
research. We had just started the PIK-19 aircraft project and one of the first items we built was a wind tunnel model of the plane to measure its aerodynamic characteristics.
The model must be accurate and, therefore, is time consuming and quite
expensive to build. A 3D-model created in the computer may also be time
consuming to create as is the preparation for CFD. The final
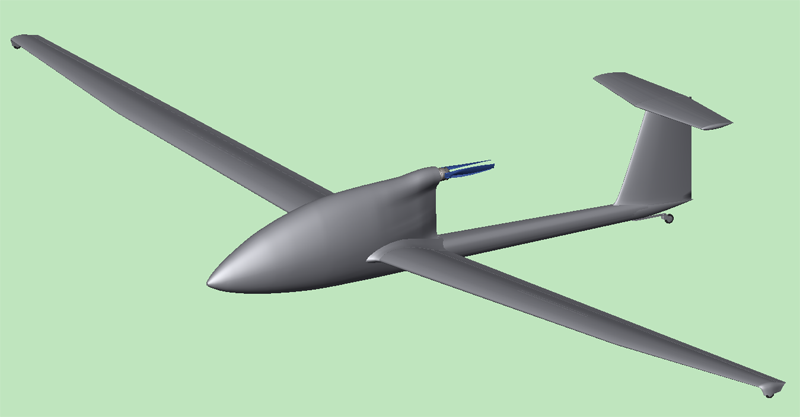
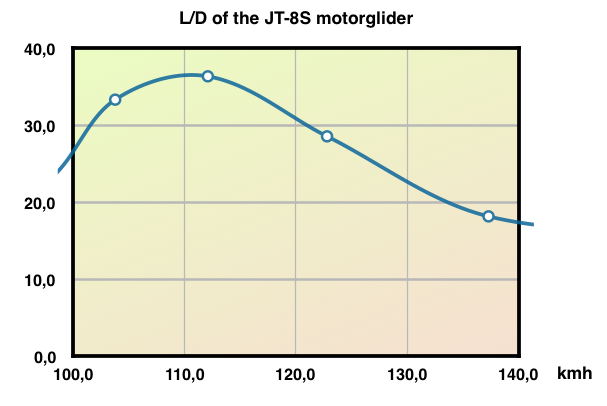
computation usually requires a set of multicore computers to do the job. Googling the net reveals a bunch of CFD-programs, some are professional and very expensive, some are even free. The Flow Design from Autodesk is something in between. I decided to give it a try to see what results a hobby aircraft designer could get using the CFD and his own 3d models. I first tested the Flow Design with aerodynamic primitive shapes and got the same drag coefficient (cd) values that are given in various text books. I then wanted to measure the L/D of my JT-8 motorglider design but immediately found that the Flow Design only calculates the drag, not the lift at all. However, by calculating the the angle of attack of the wing at various speeds to produce a lift of 4000 N (Gross weight 400 kg) with normal aerodynamic equations (in a spread sheet) and then using these values in Flow Design to get the corresponding drag values I got the L/D curve. L/D curve is the most important item for high performance gliders. I got values which were close to what I expected but the method is laborious and apparently not very reliable.
Making further search in the net I finally found several
reports describing a CFD analysis of high performance gliders. A
good example was the German University report of a Schemp-Hirth Discus
glider. The model was created using Catia V5 3D modeler and measured in
professional Ansys CFD software. It appeared that the model
had to be very precise to give proper results.
I also contacted professor Timo Siikonen from Aalto University (A new name for the same university where I was educated 50 years earlier). He is a specialist in the flow simulation and CFD. He let me read his impressive lectures. Learning aerodynamics has totally changed in 50 years. Professor Siikonen recommended software like Open FOAM and Ansys Fluent for CFD. 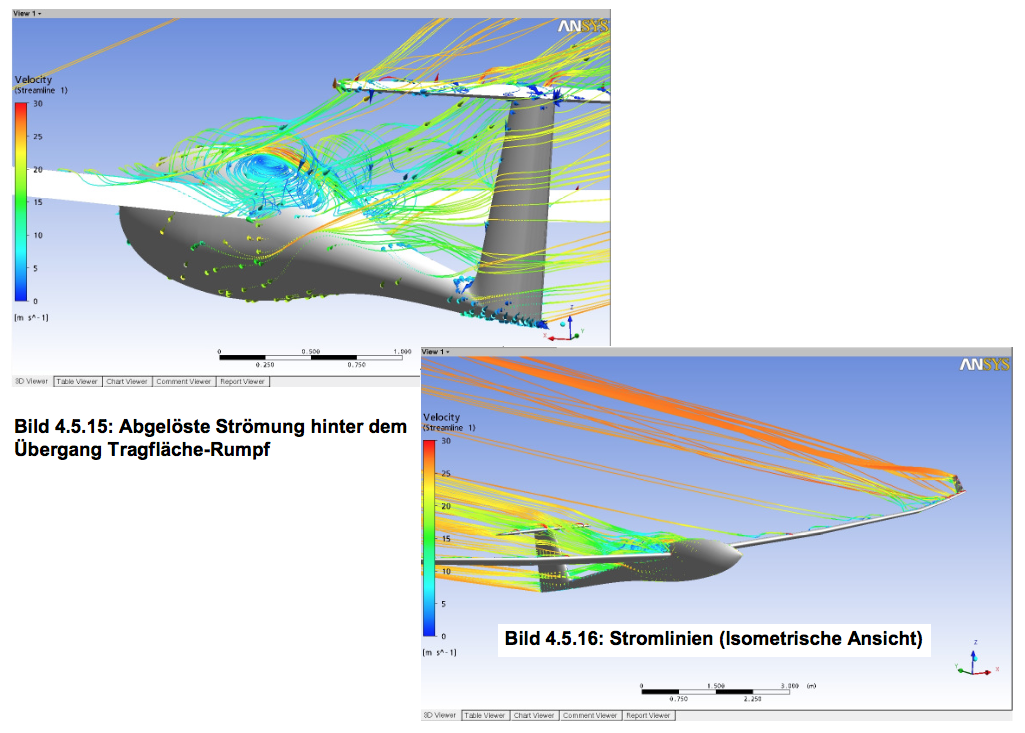 | ||||||
|
CFD for Rotary Wing Aircraft
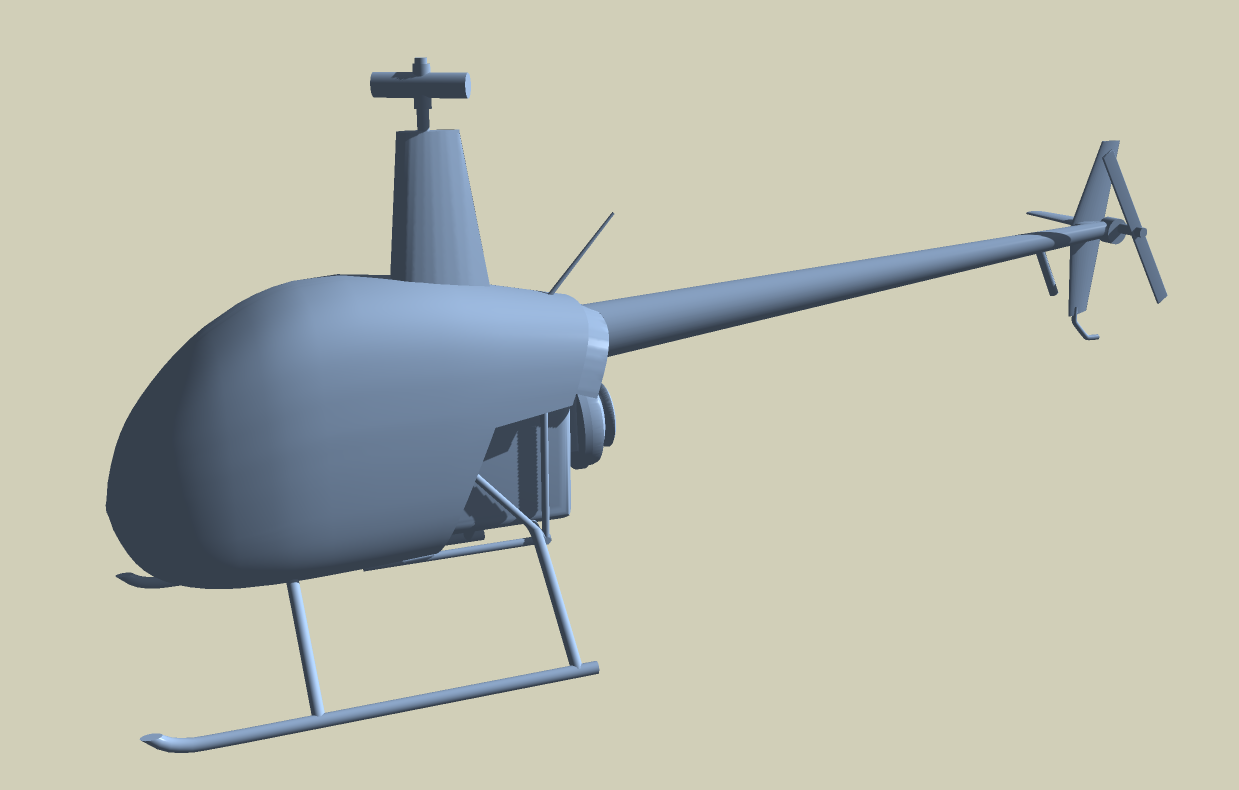
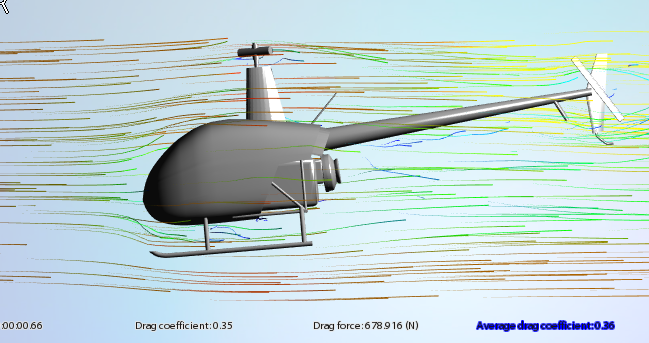
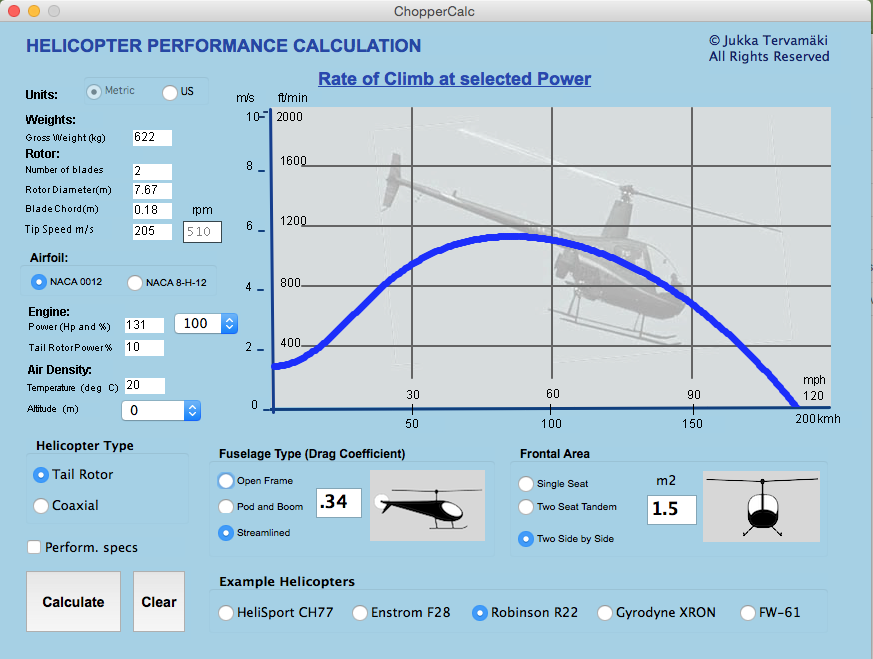
About two decades ago I coded a program by name GyroCalc for the performance calculation of autogyros. The purpose of this program was give autogyro builders and enthusiast a tool to get a first impression of whether their creation can fly or not. A few years ago I wrote the ChopperCalc, a similar program for the helicopters. Rotor aerodynamics is well defined in these programs based on NACA papers but the fuselage drag is only estimated in very rough steps. It suddenly dawned to me that the Flow Design could be the tool to find out the value of the drag coefficient for rotorcraft fuselages if I only had a 3d model of them. So I proceeded to test this approach. I already had a 3D model of the Magni M24 Orion autogyro and I also created a model for the Robinson R22 helicopter. I tested both of them in the Flow Design virtual wind tunnel. Using the drag coefficient from FD the ChopperCalc gave the real performance of the R22 helicopter. The Robinson R22 helicopter model. | ||||||
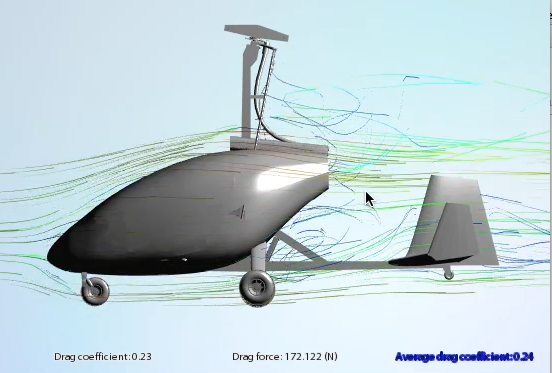
The Magni M24 Orion
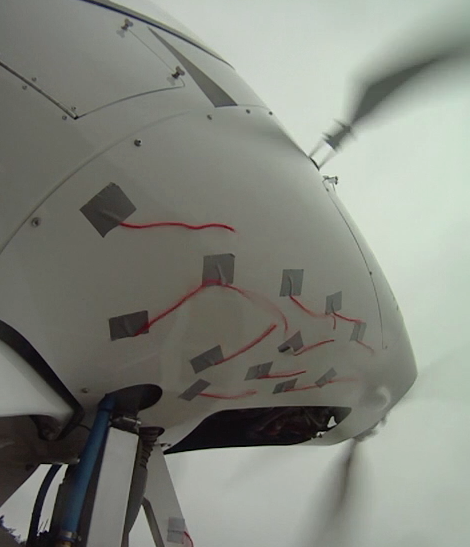
The Fow Design gave a drag coefficient of 0.23 to 0.28 (depending on the fuselage angle) which results in about the real performance of the machine. Perhaps a more interesting detail is the flow pattern in the aft fuselage area which has a pretty tight curvature and probably a flow separation. This appears to be the case in both the virtual tunnel and in real flight. We tested this by taping short woolen threads into aft fuselage and by making a movie of them in the air. Click the pictures to see the QuickTime movies. In spite of this turbulence the Cd of the M24 appears to be quite low (0.23 to 0.28). We even tested two cooling radiator positions as can be seen in this photo. There was not much difference in drag.
The movie is from an
engine idle situation just before landing. At cruise power the propeller generates an air
stream that makes the flow more stable. I could not simulate the propeller
effect in the Flow Design but managed to make a corresponding 2D simulation in iOS Wtunnel app.
Drag Comparisons An interesting possibility is to compare the drag coefficient of different gyro configurations. Now, there are hundreds of homebuilt gyro designs each with the builders own ideas. I cannot compare them all but only some of my own designs of which I have created a 3D model. So, I prepared an stl-file of 4 single seat gyro configurations without rotor and propeller to be measured in Flow Design. 1) an open frame gyro 2) a gyro with a windshield 3) a fully closed gyro with an aerodynamic cockpit 4) and the same as above with wheel and rotor head fairings. The Flow Design measurements of these models at 30 m/s (= 108 km/h, 65 mph) gave some surprises to me. It appeared that I have greatly overestimated the drag of an open frame gyro in my GyroCalc program and also overestimated the drag reduction of wheel and rotor head fairings, which had no effect at all if one can trust in the Flow Design results. The Flow Design drag measurement takes time to stabilize and the open frame measurements gave results between Cd = 0.55 and 0.68. This was much lower than I expected and therefore I tested the pilot alone in two positions, upright (as in a Bensen B8m) and in a more leaning position as in my gyro designs. The third man is one provided by AUTODESK, but modified to be in sitting position. The results are shown below and are similar to values in some papers concerning the drag of a human body. 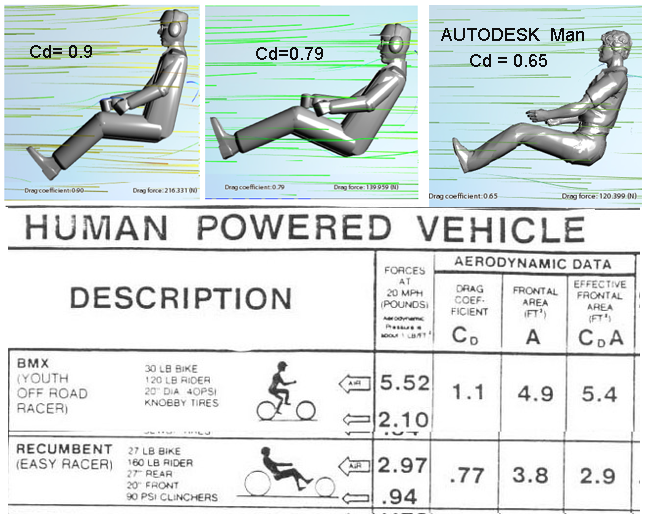 http://download.autodesk.com/us/flow_design/Flow_Design_Preliminary_Validation_Brief_01072014.pdf http://simhub.autodesk.com/resources/flow-design-automotive-drag-validation-study Anyway, based on these results I have updated my GyroCalc code and published new program files on my GyroCalc page. 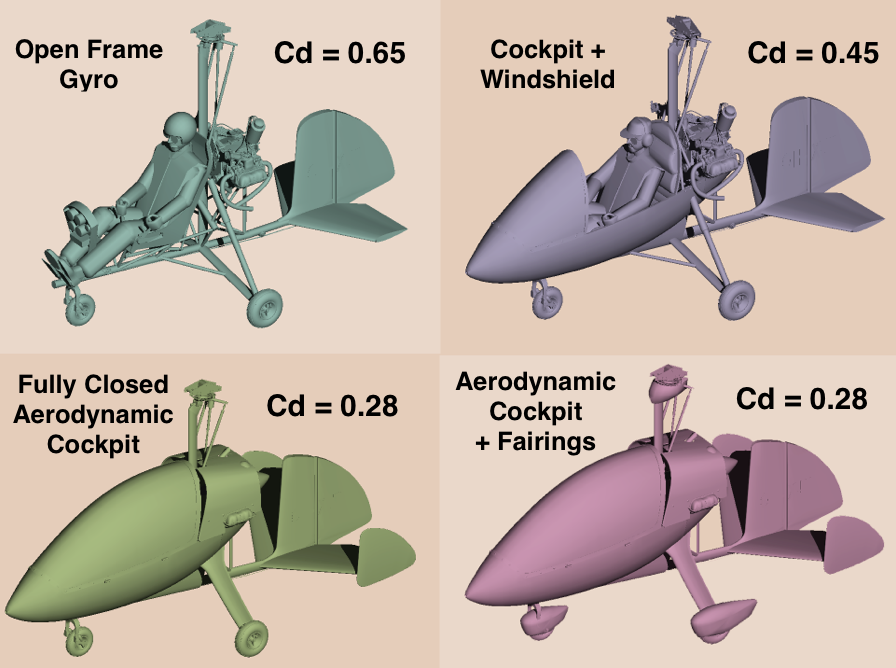 | ||||||
| Conclusions: The FEA software like Z88Aurora appears to be quite usable for a hobby engineer in many engineering problems but one must understand the principles of the stress calculation to use it. The CFD is a considerably more complex area to use by a hobbyist involving the understanding of concepts like laminar flow, turbulent flow, transition, Reynolds number, etc. The mathematics are very complex. However, Autodesk has managed to create quite a simple program to use, the Flow Design, which gives the possibility to visualize the air flow around your 3D model and results the drag coefficient and actual drag at selected speed. The user interface of the Flow Design (Mac version) is somewhat gawky and should be ironed out. And do not expect to get the wing lift of your model. | ||||||
|
|

